The Executive's Guide to Developer Experience: From Happier Coders to Healthier Profits
- Avalia

- Sep 10
- 4 min read

The efficiency and effectiveness of your software engineering teams are paramount to business success. While CIOs and CTOs have long focused on developer productivity, a crucial underlying factor is often overlooked: Developer Experience (DevEx). A superior DevEx is the bedrock of a high-performing tech organization, directly impacting everything from talent retention to your bottom line.
This article will guide you through the process of measuring the Return on Investment (ROI) of your DevEx initiatives, transforming a seemingly "soft" metric into a hard business case. At Avalia, we built the DX Hub precisely to give leaders this visibility, turning Developer Experience into measurable, executive-ready insights.
Moving Beyond Vanity Metrics
For too long, the industry has struggled with measuring developer productivity, often resorting to vanity metrics like lines of code or number of commits. These metrics are not only misleading but can also incentivize the wrong behaviors.
A truly effective approach focuses on outcomes, not just output. This is where a robust DevEx strategy comes into play.
A positive Developer Experience is characterized by a low-friction environment where developers can focus on creative problem-solving and delivering value.
It encompasses everything from the quality of their tools and workflows to the clarity of documentation and the autonomy they have in their roles.
When DevEx is prioritized, the result is a more engaged, productive, and innovative engineering team.
The Core Metrics: What to Measure
To build a compelling business case for investing in DevEx, you need to anchor your efforts in quantifiable metrics. Two industry-recognized frameworks are invaluable here: DORA metrics and the SPACE framework.
DORA Metrics: The Four Pillars of High-Performing Teams
The DevOps Research and Assessment (DORA) metrics measure software delivery performance through four indicators:
Deployment Frequency: How often you successfully release code to production.
Lead Time for Changes: The time it takes to get committed code into production.
Change Failure Rate: The percentage of deployments that cause a failure in production.
Time to Restore Service: How long it takes to recover from a failure in production.
Improvements in these metrics are a direct reflection of a better DevEx.
The SPACE Framework: A Holistic View of Developer Productivity
Developed by Microsoft and University of Victoria researchers, the SPACE framework adds a broader perspective across five dimensions:
Satisfaction and Well-being: How developers feel about their work, tools, and culture.
Performance: The outcomes and impact of developer work.
Activity: The actions and outputs of developers.
Communication and Collaboration: The quality and efficiency of team interactions.
Efficiency and Flow: The ability to complete work with minimal interruptions and delays.
By combining DORA with SPACE, leaders can gain a comprehensive view of DevEx. The challenge, however, is consolidating these insights into a business language that resonates with the C-suite. This is exactly where Avalia’s DX Hub helps: it brings these technical signals into a single, business-oriented dashboard.
Calculating the ROI: A Practical Case Study
Let’s consider a realistic scenario to illustrate how to calculate the ROI of a specific DevEx initiative.
The Problem: A company with a 100-person engineering team identifies through developer surveys (SPACE framework) and workflow analysis that their CI/CD pipeline is a major source of frustration. The average build and test cycle takes 45 minutes, and developers often context-switch while waiting.
The Investment: The company invests $150,000 per year in new CI/CD tooling and infrastructure.
The Measurement: After six months, they track:
Reduced Build and Test Time: From 45 to 15 minutes (30 minutes saved).
Increased Deployment Frequency: Multiple daily deployments instead of a few per week (clear DORA improvement).
Improved Developer Satisfaction: Surveys show a marked increase in satisfaction with tools and workflows.
The ROI Calculation:
Time Saved per Developer per Day: 3 builds × 30 minutes = 90 minutes.
Time Saved per Week: 7.5 hours × 100 developers = 750 hours.
Value of Time Saved: 750 hours × $75/hour = $56,250 per week.
Annual Value: $2,925,000.
ROI: (($2,925,000 – $150,000) / $150,000) × 100 = 1850%.
This simplified example demonstrates the staggering ROI of well-targeted DevEx improvements. Clients using Avalia’s DX Hub often uncover similar bottlenecks — and the platform highlights exactly where investments will deliver the highest returns.
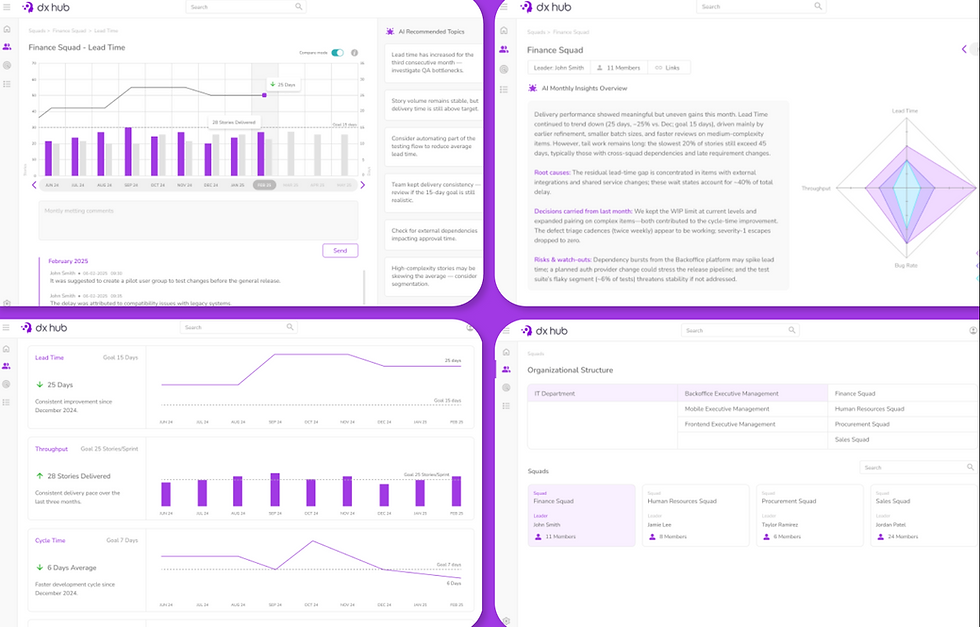
Presenting the Case: The Executive Dashboard
To secure buy-in from executives, metrics need to be communicated in business terms. A Developer Experience dashboard should visualize trends over time for:
Lead Time for Changes → impacts speed to market.
Deployment Frequency → agility and responsiveness.
Change Failure Rate → quality and stability.
Developer Retention Rate → satisfaction and cost-saving.
Innovation vs. Maintenance Time → where effort is being spent.
A Strategic Imperative
A superior Developer Experience is not a luxury — it’s a strategic imperative. By moving beyond outdated productivity metrics and adopting a holistic, data-driven approach, CIOs and CTOs can transform their technology teams into visible drivers of business success.
That’s why we created DX Hub: to give organizations a practical way to measure, improve, and communicate Developer Experience. It’s not just about developer productivity — it’s about proving IT’s value to the business, fostering innovation, and building a healthier bottom line.